

Skewness and its meaning
In statistics, the asymmetry or skewness indicates the absence of specularity of a distribution with respect to any vertical axis. If a unimodal distribution (Fig. 1)
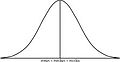
fig. 1
exists a value a such that it the equality f(x) = g(|x- a|) is satisfied. In this case, the distribution is symmetric with respect to a, where the mean and the median coincide. The relationship between the mean and the median are used to verify whether a distribution presents symmetrical or asymmetrical features; in fact symmetry occurs when the mean is equal to the median, while positive asymmetry occurs when the median is lower than the mean. This means that the distribution presents a heavier right tail than the left one. In the opposite case, when median is larger than the mean, negative asymmetry is considered. For the calculation of the asymmetry index, we use the standardized third central moment. In addition, along with various statistics, we present the box-plot informational graphic, we will explain briefly what it is. The so-called box-plot is a type of graphical representation proposed by the American statistician J.W. Tukey. It consists by a series of data from which significant measures are obtained by neglecting those which are less important. The graph is constructed as follows. It is represented (oriented horizontally or vertically) using a rectangle divided into two parts, from which emerge two segments. The rectangle (the “box”) is defined by the first and third quartile, q1/4 and q3/4, and internally divided by the median, q1/2. The segments (the “whiskers”) are delimited by the minimum and maximum values in the data. In this way are plotted four equally populated intervals delimited by the quartiles. It is a graphical representation used to describe the distribution of a sample by means of simple indices of dispersion and position.